Telephone: 619-554-9889 (MW); 217-244-0188 (BC)
Fax: 619-554-6649 (MW); 217-244-7468 (BC)
email: mike@scripps.edu; bcarr@uiuc.edu
Running title: Helical Processing using PHOELIX
Key words: Helical reconstruction, Fourier Bessel reconstruction, automated software.
Abstract
We describe here a set of procedures and algorithms for helical processing that we refer to as the PHOELIX package. The package was developed to provide a time efficient and semi-automated method for determining a three dimensional density map from a specimen with helical symmetry. The procedures which are part of PHOELIX are drawn from the original MRC helical processing suite with extensions principally developed using the SUPRIM image processing package. The package in its current form has been optimized for the processing of actomyosin filaments but has been modified and applied to other helical structures.
Introduction
PHOELIX is a set of programs and UNIX shell scripts grouped together into a package designed to provide a rational and efficient interface to procedures for reconstructing objects with helical symmetry. The routines are an attempt to automate as completely as possible all steps required in proceeding from digitized images to a final 3D density map. Parameters are automatically passed between routines and algorithms have been developed to simulate decisions which would be made by an operator. Control and monitoring of the process is maintained by presenting intermediate results to the operator and by allowing the operator to override or modify decisions made by the algorithms. The entire process may be run either interactively or in batch mode. In the latter case the results are presented to the operator after completion of all steps. If the operator then decides to override any of the decisions made by the algorithms the process may be restarted from that point.
The PHOELIX package draws heavily on two existing sets of programs; the original MRC routines for helical processing [Moore, Huxley, and DeRosier, 1970; DeRosier and Moore, 1970] and the SUPRIM software package [Schroeter and Bretaudiere, 1995]. We have associated an independent name with this repackaged and extended set of routines for reasons of clarity and convenience and in order to emphasize that there are several additions and modifications as compared to the routines which are currently in general use. Most of these additional routines have been written as extensions to SUPRIM and adhere to the philosophy of developing modular filters compatible with the UNIX operating system. PHOELIX is similar in several ways to the semi-automated set of routines developed by DeRosier and Morgan [Morgan and DeRosier, 1992] for helical processing but has been developed for UNIX operating systems and the Silicon Graphics graphics language.
The PHOELIX package has dramatically improved the efficiency with which we are able to process filaments of actomyosin, and the increased signal/noise has allowed the determination of actomyosin 3D maps at ~25 Ĺ resolution, compared to ~35 Ĺ previously. It should be readily adaptable to other helical filaments and its highly modular structure allows for the easy modification or incorporation of additional or improved procedures. The package is available on request by sending email to mike@scripps.edu or bcarr@uiuc.edu.
Overview
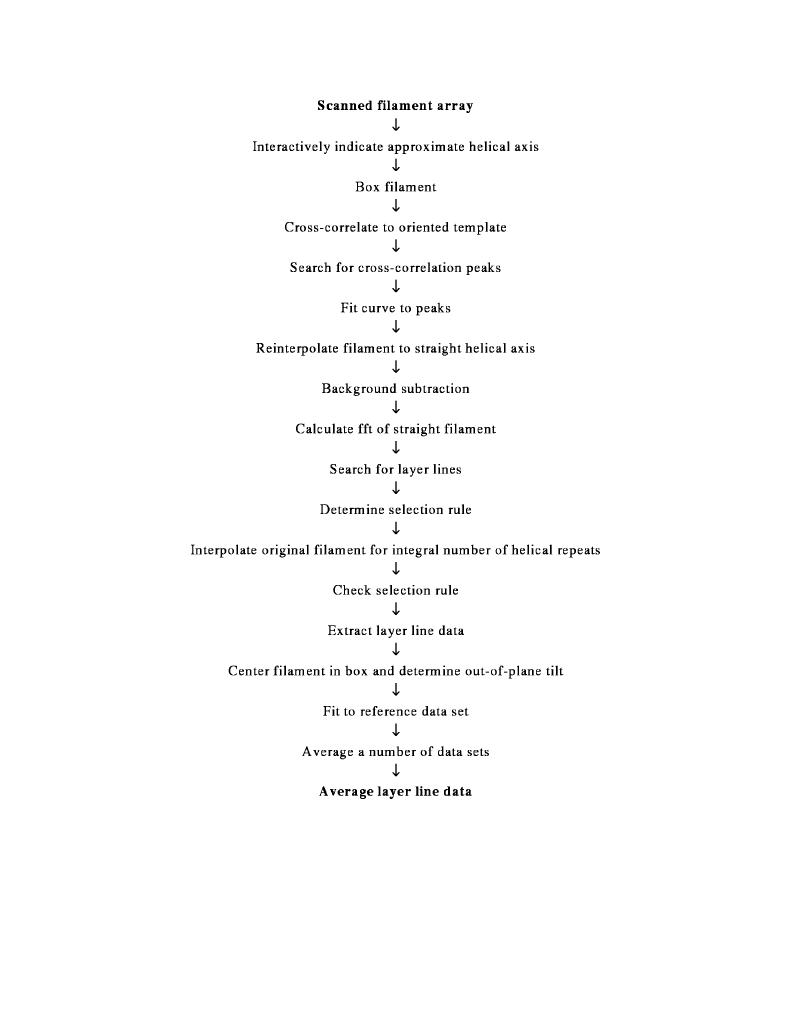
The series of steps which are required to proceed from a set of digitized micrographs to a final 3D density map are organized by the PHOELIX package as shown schematically in figure 1. Briefly, the filaments must be straightened; layer lines must be identified in the Fourier transform according to some selection rule; these layer lines must be corrected for tilt and shift; brought to a common phase origin with all other filaments to be used in calculating the final average structure; and the final density map must be calculated by Fourier Bessel inversion and summation. These steps have been described several times before [Milligan and Flicker, 1987, Unwin, 1993, McGough et al. 1994, Whittaker et al, 1995] and are not presented in any detail here. We will however very briefly highlight some of the steps which are designed to emulate the operator decisions and present brief details of some new additions and improvements to the PHOELIX package.
The package is organized as a series of scripts written for the UNIX c shell [Coffin, 1988]. For consistency with existing code those additions we have made to the SUPRIM package are written in the c language, while those made to the MRC package are written in FORTRAN. There are, however, no language-specific barriers within these packages, and since interaction with PHOELIX is at the unix command level any unix executable file may be inserted regardless of the language of origin. A large number of parameters which control these scripts, e.g. limits of search protocols, selection rule data, etc., are grouped for convenience into a single text file which can be customized by the operator for a specific specimen. The package is started by executing a master script which then sequentially calls each of the other scripts in turn. Parameters are passed between these scripts either through the master script or by data files created during execution. In keeping with the modular design of the PHOELIX package, the master script and any of the subscripts may be readily edited to change the order of routines which are called, substitute other calls or improved routines in place of those currently used, or add additional steps into the procedures. The user is kept informed of the progress of each step using terse comments and by printing the results of any interesting parameters. There are three points during the procedure at which the user is asked to inspect the data and make a decision as to the validity of results calculated by the automatic decision- making algorithms. These points are 1) approval or correction of cross correlation peaks defining the path of the filament; 2) determination of a layer line intercept when a located intercept differs by more than one pixel from its location as predicted from the selection rule; 3) approval or correction of peaks to be used for tilt/shift correction. The user may either edit these results, accept them without modification or halt the entire process if there appears to be a problem. There are also several points during the processes where the routines will automatically halt if results are found to be outside of limits set by the user in the parameter file. Figure 2 represents and describes the appearance of the users screen at a time point in these procedures.
Implementation
Details regarding the SUPRIM and MRC packages are presented elsewhere in this special issue of JSB, and routines that were developed specifically as part of PHOELIX have been described in detail previously [Whittaker et al., 1995]. Here we will limit our description only to two procedures which were recently modified, and also make very brief mention of two other procedures which involve software designed to emulate decisions normally made by the user. An extensive appendix containing additional documentation on all software modules used in the package is available as part of the PHOELIX distribution.
Straightening
Reconstruction of the helical structure relies on identification of layer lines from a number of images which are then brought to a common phase origin and averaged. The resolution of the final data set is dependent on the resolution to which layer lines can be reliably identified or predicted. The identification of layer lines is made considerably easier if the signal/noise ratio of the transform can be improved by increasing the number of contributing unit cells. This requires that unit cells be related strictly by helical symmetry, and therefore requires a straight helical axis. For this reason we have spent some time optimizing automated procedures to identify the path of the helical axis and thus correct curvature in our filaments. Our initial procedures relied on the identification of peaks in the cross correlation function calculated between the entire filament and a template image (typically a small section of the original filament or a small segment of a model calculated previously). A more accurate identification of the filament axis can be achieved by first orienting the template to match the local orientation of a short segment of the original filament and then calculating a cross correlation between the reoriented template and this short segment of filament. This procedure is then repeated along the length of the filament. We have implemented such a procedure by having the user trace the approximate filament axis through identification a few points along the filament. A spline curve fitted to this axis provides the approximate local curvature of each filament segment. The method is not significantly slower than our previous method and the increase in sharpness of the cross correlation peak results in many fewer spurious peaks which must be removed manually. It should be noted that, owing to the modular nature of the PHOELIX package, this new straightening algorithm was simply substituted in place of the old algorithm by changing a single line in the master script.
Determination of selection rule.
Layer lines in the transform of the straightened filament are located by searching for peaks in a projection of the transform onto the central meridian. The peak search is controlled by parameters which describe the crossover length of the helix and the pixel size of the digitized image. The layer lines thus located are used to choose a selection rule which best fits the data from a library of possible selection rules provided by the user. Based on this selection rule the filament is then reboxed and restraightened using the original digitized image so that the final image contains an integral number of helical repeats. The selection rule is then checked for consistency and the final image is background corrected and floated to a mean of zero. This method, while useful for actomyosin, may not work for all specimens. For such a specimen the user would need only to replace this module with one more appropriate. We have recently made the changes necessary for processing microtubules displaying helical symmetry.
Correction for tilt and centering the helical axis.
Correcting the layer line data for out-of-plane tilt, centering in the transform box, fitting to a reference data set and averaging was performed essentially as previously described [Milligan and Flicker, 1987]. Correction for tilt and centering require the user to specify amplitude peaks on certain strong layer lines which approximately match across the meridian. These peaks are determined computationally by identifying the amplitude maximum in the vector average of the near and far side of each layer line. In interactive mode the amplitude peaks selected in this way are presented graphically to the operator and may be edited if desired.
Sniffer.
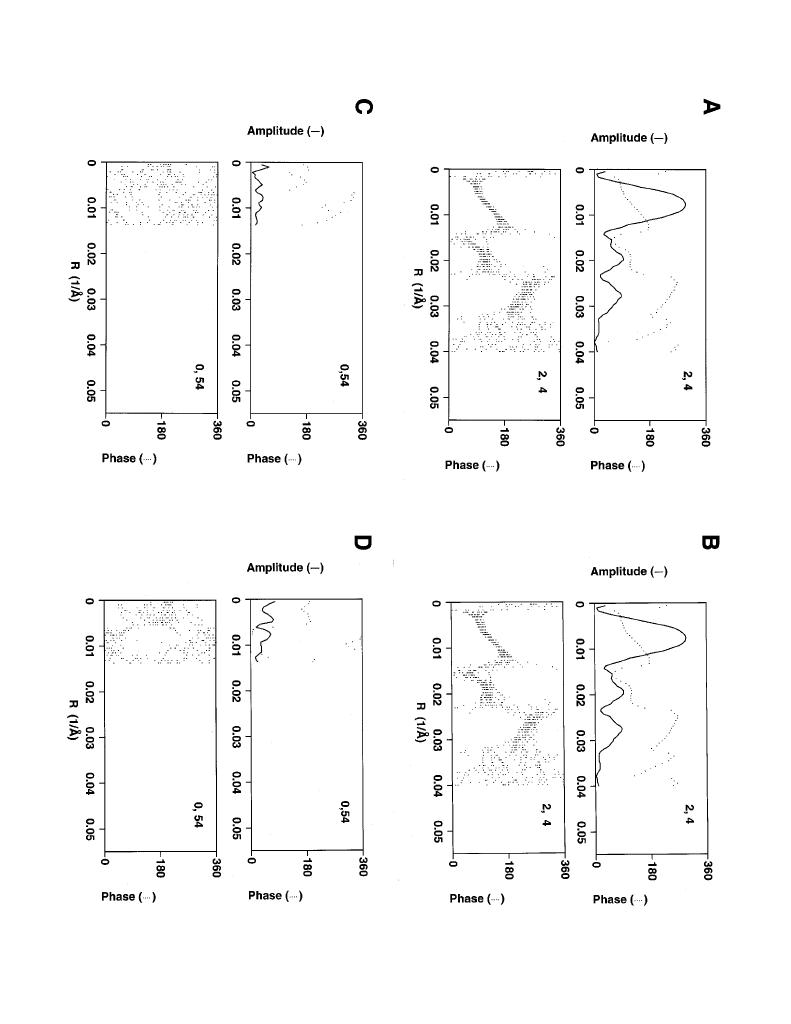
In an effort to increase signal on high resolution layer lines we have also implemented a layer line "sniffer" algorithm as described by Morgan and DeRosier [Morgan et al., 1995]. For high order layer lines where the signal/noise ratio of the Fourier transform is low, it is not possible to determine the layer line position by searching directly for a peak in the transform. Instead these high order layer lines are extracted by predicting their position based on the selection rule determined as described above. Imprecision in the estimate of average layer line spacing may result in the actual position of the high order layer lines deviating from their predicted position, thus limiting the resolution which can be achieved. The sniffer algorithm proceeds by calculating a phase residual between each layer line in the average data set and a set of layer lines centered around the predicted layer line position for each individual filament. The layer line which results in the lowest phase residual is extracted to form a new average and the process is iterated. The result of this sniffing procedure on layer lines taken from a reconstruction of an actomyosin filament is shown in figure 3. Average amplitudes and phases, as well as the phase components of all data sets contained in the average, are shown before and after sniffing for one strong and one weak layer line. Note that on the strong layer line (e.g. n,l 2,4) there is little gained by sniffing due to the strong signal which allows for an accurate determination of the layer line intercept. In contrast, on the weak layer line (e.g. n,l 0,54) phases become much more consistent between filaments, resulting in an increase in amplitude following averaging.
User interface
The package as written consists of a series of programs including many from the SUPRIM package, the MRC package, a number of custom programs written specifically for this purpose and several public domain programs (e.g. xgraph, David Harrison, University of California). The principal data formats used are those specific to the MRC programs and the SUPRIM package. Data is converted between these formats as required using routines called as part of the controlling scripts.
We view the PHOELIX package as a flexible set of tools which may be configured in any number of ways, hence we have provided no graphical user interface. During testing mode or when developing new routines the user may set start and stop points inside the shell scripts so as to test small portions of the package without necessarily running the entire process from beginning to end. While we have often considered the possibility of developing a graphical user interface (GUI) we have always concluded that the current very simple interface keeps the system as flexible as possible. The large commitment of time required to develop and maintain a GUI tends to hinder the process of developing new procedures or modifying the order or manner in which current ones are called. For the same reason we have adhered to the paradigm suggested by Jean-Pierre Bretaudiere in the development of the SUPRIM package [Schroeter and Bretaudiere, 1995] in basing the overall design, interaction and inter-process communication on the UNIX operating system. The rationale for this is that as these software packages are based on a UNIX processor, any user will of necessity be required to learn the rudiments of this system and should not be required to learn yet another paradigm and instruction set. The lack of a user interface means that the operator is required to be able to edit a file in order to run the package and to understand basic c-shell script calls in order to modify and add to the package. In our experience these skills are readily acquired even by computer novices.
Discussion
The set of routines which we refer to as PHOELIX has been extensively applied to the reconstruction of filaments of actomyosin. The efficiency introduced by the streamlined procedures provides approximately a ten fold savings in the time required to calculate an average three dimensional map. Furthermore the consistency provided by the automated routines and the ability to average over much longer lengths of filaments has led to a significant improvement in the resolution obtainable in the final map.
The package as currently distributed is customized for the processing of filaments of actomyosin but has also been successfully applied to undecorated actin and microtubules. We expect that users wishing to apply the package to other filamentous proteins will initially need to spend some time in customizing the parameters which control the scripts and possibly also some of the routines that are called. The speed with which the entire process runs through to completion (approximately 10 minutes for the reconstruction of a filament of length 4096 pixels) means that a wide range of parameters can be tested in a fairly short time period. Also the highly modular structure of the package and the lack of a formal user interface means that customized routines can be readily added to the command stream. In our experience once the routines are performing satisfactorily it is possible to apply them repeatedly to similar filaments without further modifications.
We have recently made several modifications to the package, changing the method for calculating the helical axis and by adding in the "sniffer" routines. In an earlier paper we have outlined a number of additional improvements we hope to include at a future date (Whittaker et al., 1995), and it is our hope that other users will submit their new procedures to the authors so that they may be made freely available.
We wish to thank Jean-Pierre Bretaudiere and John Schroeter for generously providing us with the SUPRIM processing package which formed the basis for the development of this system. We would also like to thank Michael Schmid and Wah Chiu for providing the UNIX compatible MRC libraries. Finally we would like to thank the numerous people who have contributed to the MRC package of programs and for so generously providing these to the user community. This work was supported by grants AR39155, GM44932, and GM52468 (to R.A.M.) from the National Institutes of Health. R.A.M. is an Established Investigator of the American Heart Association.
Figure Captions
Figure 1. Schematic diagram of the PHOELIX helical processing package. A detailed description of each step and the programs used is available as part of the PHOELIX distribution.
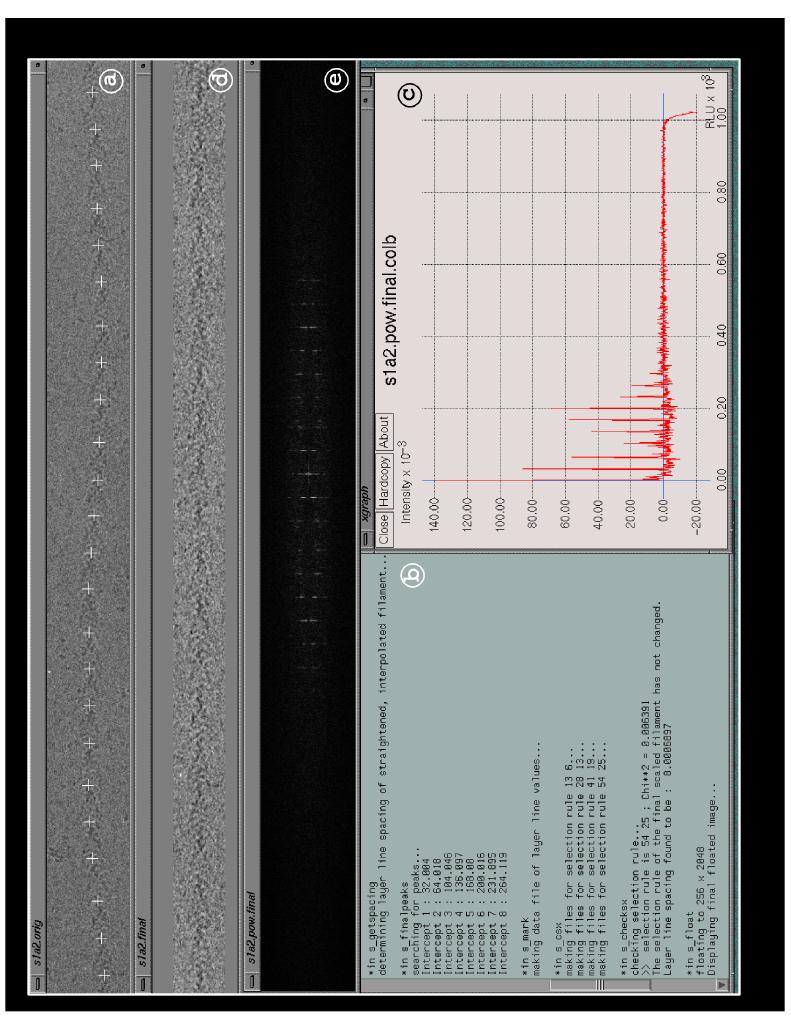
Figure 2. A snapshot of the screen following the initial portion of the helical processing. At this stage the filament axis has been examined and edited if required (a), the selection rule has been determined (b), the layer lines have been displayed (c) and the final straightened filament (d) and its power spectrum (e) displayed. All of the text echoed to the screen can be saved as a log file to provide a permanent record of the processing.
Figure 3. Results of layer line sniffing. Average amplitudes and phases (upper panel of each pair of graphs) along with the phase components of all data comprising the average (lower panel of each pair) are presented for a strong (n,l 2,4) and a weak (n,l 0,54) layer line from an actomyosin data set. Note that the data in these plots have been truncated to 25 Ĺ, the first zero in the contrast transfer function. For the strong layer line there is little or no change comparing the data before (A) and after (B) sniffing as the high signal/noise allows for accurate determination of the layer line intercept. In contrast, phases become much more consistent between data sets following sniffing (D, lower panel) in comparison to the same data before sniffing (C). As a result, an increase in the amplitude is noted following averaging on this layer line (compare upper panels of D to C).
References
Coffin, S., (1988) UNIX: The Complete Reference. McGraw-Hill.
DeRosier, D.J. and P.B. Moore. (1970) Reconstruction of three dimensional images from electron micrographs of structures with helical symmetry. J. Mol. Biol. 52 355-369
McGough, A., M. Way, DeRosier, (1994) Determination of the alpha-actinin binding site on actin filaments by cryoelectron microscopy and image analysis. D. J. Cell Biol. 126 433-443
Milligan, R.A. and P.F Flicker. (1987) Structural relationships of actin, myosin, and tropomyosin revealed by cryo-electron microscopy. J. Cell Biol. 105 29-39
Moore, P.B., H.E. Huxley, and D.J. DeRosier. (1970) Three-dimensional reconstruction of F-actin, thin filaments and decorated thin filaments. J. Mol. Biol. 50 279-295
Morgan, D.G. and D. DeRosier. (1992) Processing images of helical structures: A new twist. Ultramicroscopy 46 263-285
Morgan, D.G., Owen, C., Melanson, L.A. and DeRosier, D.J. (1995) Structure of bacterial flagellar filaments at 11A resolution: Packing of the alpha helices. J. Mol. Biol. 249 88-110.
Schroeter, J.P. and Bretaudiere, J. (1995) J. Struct. Biol, this issue.
Unwin N. (1993) Nicotinic acetylcholine receptor at 9Ĺ resolution. J. Mol. Biol. 229 1101-24
Whittaker,M., Carragher, B., and Milligan, R.A. (1995) PHOELIX: A package for helical reconstruction. Ultramicroscopy. 58:245-259